Tabular Reports
Tabular Reports typically display data in a tabular format, ideal for export to Excel. Depending on the nature of the columns, data can be totalled accordingly. Rows can be grouped by dragging a particular column header to the top section of the report (dependent on a setting defined when creating the report).
A Tabular Report is organized in a multicolumn, multi-row format, with each column corresponding to a column in the database table.
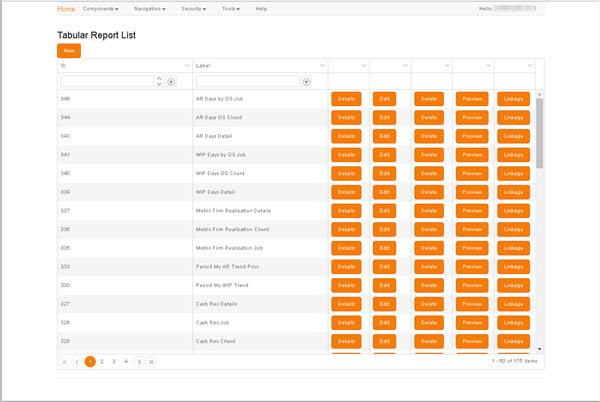
Tabular Reports are managed via the Tabular Report List.
To access the Tabular Report List:
- In the Setup menu bar, select Components / Tabular Reports.
To define a new report:
- Click New to display the Create Tabular Report screen.
The grid presents a listing of each existing Tabular Report, one per grid row.
To locate an existing report, use either the filters in the column headers or the scroll bar and the page navigation controls in the grid footer (for details, see Column Filters and Page Navigation).
The buttons on each row present the following options:
- Details - Displays the Tabular Report Details screen, which presents a summary of the report's basic details, its Query Definition, and a searchable Column List. The Details screen also provides access to Edit and Preview functions (as on this screen).
- Edit - Displays the Edit Tabular Report screen.
- Layout - Displays the Layout screen, in which you can define or edit the layout of a report.
- Delete - Displays a Delete Confirmation prompt, in which you are prompted to confirm the deletion of the report.
-
Preview - Displays a preview of the selected report in a new tab.
Previews are dependent on Group permissions. For details, see Security.
- Linkage - Displays a Report Hierarchy, which illustrates any existing links to or from the selected report, and enables you to create new links. For details, see Linkage.